
In Ireland, there are many studies which have examined the spatial patterns of economic recession and the following recovery between its own regions (see also a previous blog I have written on this here: https://tionchar.wordpress.com/2015/07/03/bounce-back-economic-resilience-of-irish-regions-part-12/). In comparison, fewer papers have tended to map the recession and recovery in Europe while, at the same time, identifying the position of Ireland among the EU-28 states.
However, this task is crucial, for although Ireland has a relatively small economy, it has a rather open economy. On the one hand, with a strong presence of multinational technology companies (mainly from the U.S.), the Irish economy is impacted by international economic circumstances. On the other hand, Ireland is deeply integrated into the European market as it is a longstanding member of the EEA, the EU, and the Eurozone. It suffices to say that Ireland benefits most when its trading partners are performing well.
On March 10, 2016. the Central Statistics Office (CSO) published the latest quarterly national accounts, which show that Ireland’s economy grew by 7.8 per cent in 2015, outstripping all other Eurozone countries. It was also made clear that the strong recovery was a result of increases in both domestic demand and export trade. Therefore, external factors play the same, if not more, roles in driving economic recovery as internal factors do.
The analysis was based on Eurostat databases covering a decade of 2005-2015. The period was divided into two stages: 2005-2010 (to capture recession) and 2010-2015 (to measure recovery).

Figure 1 shows the change of GDP in EU-28 countries between 2005 and 2010. While some countries were terribly hit by the economic crisis of 2008, a few countries actually managed to grow their economies over the whole period.
In Figure 2 below, I compare the balance between the index of 2010 and the maximum index of the period between 2005 and 2009. While the index of 2010 is set as 100 for all countries, the maximum index of the period between 2005 and 2009 refers to the peaking amount of GDP in each country. Then, the balance between these two values means the depth of recession.

The depth of recession varies significantly between countries. The GDP shrank by more than 20 per cent between 2005 and 2010 in Latvia and Estonia, followed by countries such as Lithuania, Greece, Croatia, Romania and Ireland. In particular, Ireland was at the bottom 7 countries that have been most significantly hit by the recession. Economy in France and Sweden was only slighted weakened by the recession. Three countries, namely Belgium, Malta and Poland, were able to grow their economy until the end of 2010 in face of the crisis.
Similar to the case of recession, the recovery process if full of differences among the EU-28 countries. Figure 3 illustrates these differences.
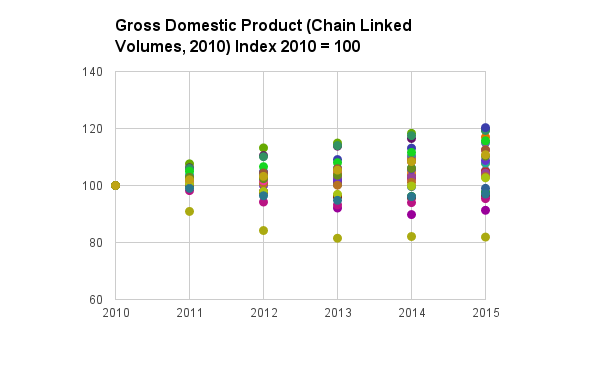
An interesting result in Figure 3 is that gaps between the best performing countries and the worst performing countries have been widening over this period. While many countries have been making progress from 2010 onwards, a few others continued to struggle with the after shock of the recession, which hit the economy even further after 2010. This means that the longevity of the recession is rather different between countries, with some states still in the middle of it.
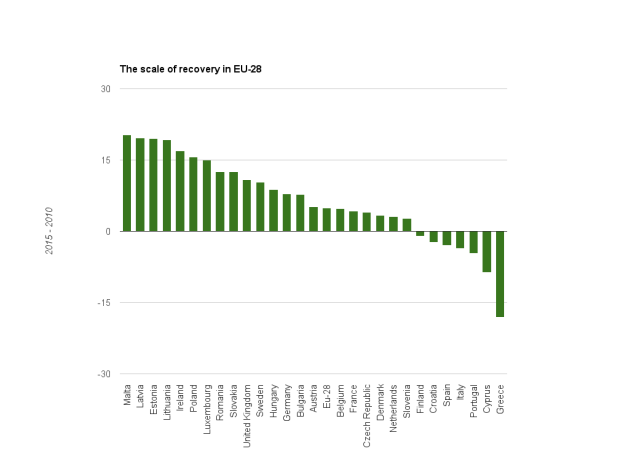
In Figure 4 above, I compare the balance between the index of 2015 and the index of 2010 (see Figure 3 for the index) to show the scale of recovery. Malta leads the rankings of countries in recovery, followed by Latvia, Estonia, Lithuania and Ireland. Ireland, which was badly hit by the recession, came back strong, with its economy growing by around 17 percent between 2010 and 2015. Countries such as Spain, Italy and Greece have not recovered from the crisis after five years. In Figure 2, we can see that Cyprus was only very slightly hit by the recession, but what Figure 4 seems to suggest is that, for Cyprus, the ‘real’ recession took place in the last few years, later than its other EU counterparts.
Finally, I would like to draw a table to comprehensively describe the recession and recovery patterns of the EU-28 countries, by combining results from both Figure 2 and Figure 4. The table is a 3*3 matrix, with one axis the depth of recession and the other axis the scale of recovery. For each axis, I group the countries into 3 groups by the level of recession or recovery. The exact categorisation method as well as the results could be seen in Table 1 below.

Ireland is among countries such as Estonia, Latvia, Lithuania and Romania in the top left block – ‘Deep Recession, Strong Recovery’. This group has the most impressive turnaround to make out of the recession. Croatia, Finland, Greece and Italy were also badly hit during the crisis, and are still trying to get back to pre-crisis level. United Kingdom and Spain are two countries which show up in their respective blocks alone, separating themselves from the other countries.
In general, this table is useful in showing the relative performance of European countries in dealing with the economic crisis. More research could be undertaken to compare a certain group of countries, such as small open economy countries.

One thought on “Recession and Recovery in Europe: Where Ireland Stands?”